


















































































Article Contents:
- Gross profit and order profit are not the same thing
- Why a large supplier discount doesn't yet mean a profitable order
- Why a supplier discount needs to be converted into absolute rubles
- First, separate PRODUCT COST from COST-TO-SERVE
- PRODUCT COST
- COST-TO-SERVE

A project order looks profitable: the client bought wooden moulding for 1,000,000 ₽, and the purchase cost of the goods was 720,000 ₽. At first glance, the difference is 280,000 ₽. But this is exactly where the misjudgment of the deal most often occurs.
The order could have required separate inbound logistics, several deliveries to the client, additional packaging for long-length items, samples, temporary storage, an urgent reorder, replacement of damaged items, and handling of the remaining rare SKU. All these costs relate not to the business "in general," but to a specific client project.
Therefore, for building materials wholesalers It is useful to calculate not only the gross difference between sale and purchase, but also Cost-to-Serve — the direct cost of servicing a specific order.
Working logic:
REVENUE → PRODUCT COST → GROSS MARGIN → COST-TO-SERVE → CONTRIBUTION MARGIN → PLANNED vs ACTUAL → MARGIN BRIDGE.
All numerical examples below are conditional and demonstrate the methodology. They are not standards, rates, or a mandatory accounting model.
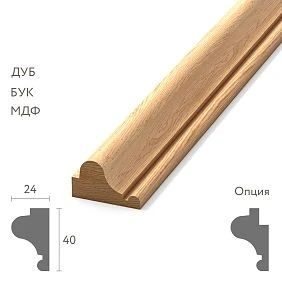
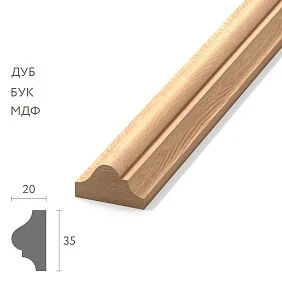
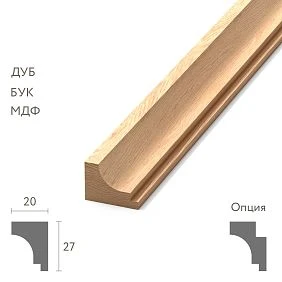
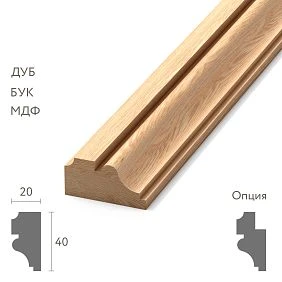
Gross profit and order profit are not the same thing
First level:
GROSS MARGIN = REVENUE − PRODUCT COST.
For example:
1 000 000 − 720 000 = 280 000 ₽
But this is not yet the result of a specific project.
Second level:
CONTRIBUTION MARGIN = REVENUE − PRODUCT COST − DIRECT COST-TO-SERVE.
It is contribution margin that shows how much the order left after those direct costs that arose specifically because the company serviced this client and this project.




Why a large supplier discount does not yet mean a profitable order
Supplier A gave a 25% discount, supplier B — 18%. It seems that A is automatically more profitable.
But A may have:
- two separate incoming deliveries;
- additional packaging;
- expensive temporary storage;
- minimum order quantity for a rare SKU;
- separate express delivery of the remaining stock.
Then the purchase discount remains attractive only on the first line of the calculation, and the overall economics of the order may turn out worse.
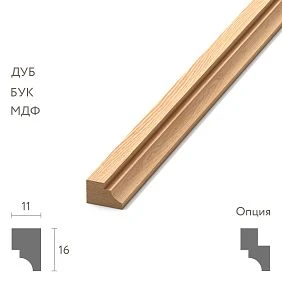
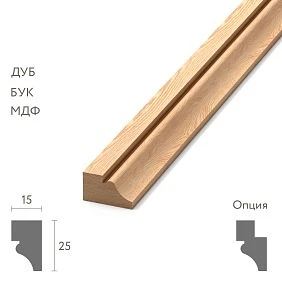
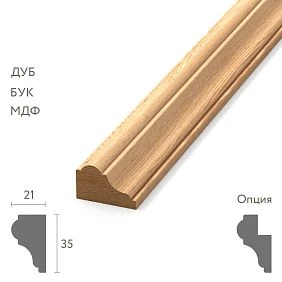
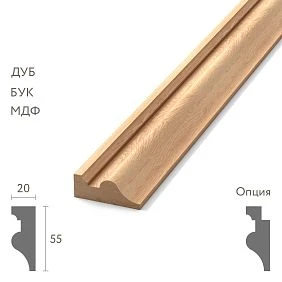
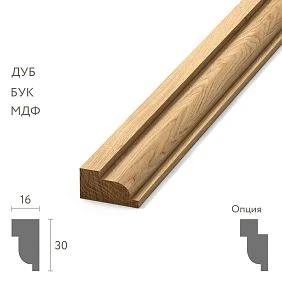
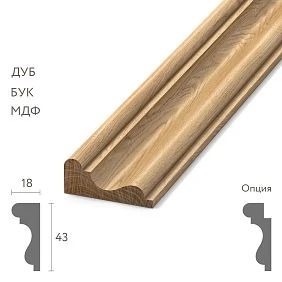
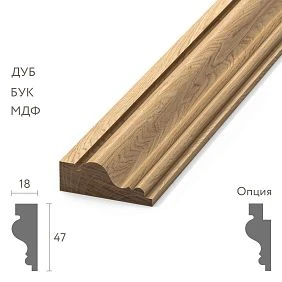
Our factory also produces:

Why a supplier discount needs to be converted into absolute rubles
The discount percentage by itself poorly shows the effect.
For example:
Price = 900,000 ₽
Discount = 20%
Savings = 180,000 ₽
But if this particular option creates additional logistics and storage costs of 70,000 ₽, the net effect of a deeper discount is already different.
For comparison, a useful formula is:
NET PROCUREMENT ADVANTAGE = procurement savings − additional direct costs.
Get Consultation
First, we separate PRODUCT COST from COST-TO-SERVE
PRODUCT COST
The cost of the goods themselves that the company purchased for the project.
COST-TO-SERVE
Direct costs so that the client actually receives the right product in the right configuration, in the right sequence, and with the necessary service.
Cost-to-Serve may include:
- inbound logistics;
- delivery to the client;
- additional packaging;
- unloading and transshipment, if paid for by the seller;
- partial shipments;
- urgent additional orders;
- samples for a specific project;
- paid storage;
- replacement under a claim;
- special operations for a specific client.
Why a wooden skirting board can deliver good margin but expensive delivery
Skirting board is a long-length product. It takes up volume, requires suitable transport and is sensitive to packaging.
Therefore, the profit from a single plank says nothing about the economics of the batch.
Why the cost of long-length goods must be calculated per order, not just per meter
The cost of transporting moulding is often determined not only by weight or the total value of the goods. Length, volume and the way the items are arranged in the vehicle all matter.
That is why two orders of equal value can have different Cost-to-Serve:
- compact items take up little space;
- long-length items require more loading length;
- a large cornice can restrict combined loading;
- fragile finishes may require additional protection.
For management assessment, it is enough to see the transport cost of the entire batch without trying to artificially split it down to the penny between each strip.
You need to look at:
margin of the entire batch − logistics of the entire batch.
This is especially noticeable on small orders, when the vehicle costs almost as much as for a larger delivery.
Delivery cost per order
Conditional example:
goods — 40,000 ₽;
delivery — 10,000 ₽.
Share of logistics:
10 000 / 40 000 = 25%.
If the goods cost 400,000 ₽ with the same delivery of 10,000 ₽:
10 000 / 400 000 = 2,5%.
The same transport rate carries a completely different weight in the two orders.
Why moulding creates hidden cost through a wide product range
The client ordered:
- MLD-A — 60 m;
- MLD-B — 25 m;
- MLD-C — 18 m.
Left over from the project:
- MLD-A — 7 m;
- MLD-B — 9 m;
- MLD-C — 5 m.
Formally, this is leftover inventory. But commercially, not every remnant is equally liquid.
SELLABLE STOCK and STRANDED PROJECT STOCK are different things
SELLABLE STOCK — a remainder that can with high probability be used in the next order.
STRANDED PROJECT STOCK — a project-specific remnant that is difficult to sell separately.
For example, 24 m of a popular skirting board can be a normal working stock. Five meters of a rare figured molding is already a different situation.
A remainder cannot automatically be considered a loss
Remaining stock can:
- be sold to the next client;
- be moved to permanent warehouse stock;
- be used as a sample;
- be needed by the same project later.
But until it is actually used, it cannot be considered equivalent to cash.
Recovery Value: what value of the remaining stock can realistically be expected to be recovered
For rare remaining stock, it is useful to use not the full purchase cost, but an estimated recoverable value.
For example:
Stranded stock at cost = 24 000 ₽
Expected recoverable value = 12 000 ₽
Then the potential economic drag:
24 000 − 12 000 = 12 000 ₽.
This is a conditional management estimate. It helps distinguish a fully liquid remaining stock from a position that will have to be sold at a discount or used partially.
For managerial Order P&L, it is useful to show separately:
STRANDED STOCK AT COST = 24 000 ₽
and not mix this amount with already realized profit.
Why a large cornice is especially sensitive to Cost-to-Serve
A cornice may have a high absolute markup, but at the same time create additional costs:
- take up a lot of space;
- require special packaging;
- be shipped in a separate vehicle;
- require careful reloading;
- be stored for a long time until the site is ready.
Therefore, a high percentage margin of a single SKU does not yet guarantee a high order contribution.
A sample also has a cost
To the client, a sample may look like a free service. For the seller, it is a separate operation.
It may include:
- the cost of the sample itself;
- packaging;
- delivery;
- marking;
- the work of the procurement manager.
If a sample helps close a large project, the expense is justified. But in Order Economics it is useful to see it.
Sample Cost can be counted as the cost of sale of a specific order
If two sample sets with a total cost of 5,000 ₽ were sent for Hotel A, and then the client placed a project order, these 5,000 ₽ can be attributed to the direct cost of sale of this project.
This does not mean that accounting should work this way. This is a management way to understand how much service cost the order required.
Where profit is most often lost already at the quotation stage
In a commercial proposal, often only the following are counted:
goods + markup.
And then, during execution, the following appear:
- packaging;
- additional delivery;
- second unloading;
- storage;
- samples;
- urgency;
- claim cost;
- additional order.
As a result, the order seems profitable only until actual execution begins.
Pre-Quote Cost Checklist
Before sending a commercial proposal, it is useful to check five blocks:
| Block | What to Check |
|---|---|
| Product | Purchase cost and discount |
| Logistics | Number of estimated trips |
| Operations | Packaging, handling, storage |
| Commercial | Customer discount and free services |
| Risk | Re-order, claims, stranded stock |
If one block remains unknown, the planned contribution must include a buffer for uncertainty, or the quote should be clarified before sending.
One order worth 500,000 ₽ and three shipments is not the same as one shipment
Customer requests:
BATCH 1 — 200 m
BATCH 2 — 180 m
BATCH 3 — 120 m
If the seller pays for each trip, Cost-to-Serve increases.
Partial shipments must have separate economics
For each batch, it is useful to see:
- DELIVERY COST;
- PACKING COST;
- HANDLING COST;
- STORAGE COST, if applicable.
Then they are added up into Order P&L.
How to calculate Cost-to-Serve by batch
| Batch | Delivery | Packing | Handling | Total |
|---|---|---|---|---|
| B01 | 12 000 | 3 000 | 2 000 | 17 000 |
| B02 | 11 000 | 2 500 | 2 000 | 15 500 |
| B03 | 10 000 | 2 000 | 1 500 | 13 500 |
Total Cost-to-Serve for just three shipments — 46,000 ₽.
If the original quote included one delivery at 18,000 ₽, a negative variance of 28,000 ₽ is already visible.
Why an urgent reorder can eat into the profit of the original deal
The client was 12 planks short.
The item costs approximately 15,000 ₽.
Urgent separate delivery — 12,000 ₽.
If the company pays for delivery itself, a small error in quantity creates a disproportionately large Cost-to-Serve.
The reason for an urgent reorder must be recorded
A reorder could have arisen due to:
- an error in the initial calculation;
- project changes;
- installation overconsumption;
- damage;
- a client-added zone.
The economic effect is the same — additional expense. But the management conclusion is different.
Rework Cost: when an order has to be handled a second time
If an error forces the product to be assembled, packed, and shipped again, a rework cost arises.
For example:
- re-packing — 2,000 ₽;
- new packaging — 1,500 ₽;
- re-delivery — 8,000 ₽.
Total:
REWORK COST = 11 500 ₽.
It is useful to attribute such costs to a cause: packing error, customer change, damage, or claim. Otherwise, all rework dissolves into general logistics.
A claim must also be reflected in the order economics
Conditional example:
4 panels damaged;
replacement cost — 8 000 ₽;
additional delivery — 9,000 ₽.
CLAIM COST = 17 000 ₽.
At the same time, the reason for the claim is determined separately. Not every claim is automatically a cost of the supplier or seller — economic responsibility depends on the specific situation and agreements.
Order P&L — mini-report for one project
| Indicator | ₽ |
|---|---|
| Revenue | 1 000 000 |
| Goods procurement | −720 000 |
| Inbound logistics | −28 000 |
| Delivery to the customer | −32 000 |
| Packaging | −11 000 |
| Samples / sales support | −5 000 |
| Claims | −9 000 |
| Extra delivery | −18 000 |
| Contribution Margin | 177 000 |
The figures are illustrative. The table shows the method: a gross difference of 280,000 ₽ after direct servicing costs turned into a contribution of 177,000 ₽.
Contribution Margin % is also useful
Formula:
CONTRIBUTION MARGIN % = CONTRIBUTION MARGIN / REVENUE × 100%.
In the example:
177 000 / 1 000 000 × 100% = 17,7%.
This percentage is convenient when you need to compare two orders of different sizes.
Building materials sales: revenue alone says nothing
Building materials sales are often compared by turnover.
Manager A sold 3 million ₽.
Manager B — 2.5 million ₽.
But A may have:
- more urgent deliveries;
- more claims;
- more manual operations;
- deeper discounts;
- worse stock levels after projects.
Then the actual contribution for B may be higher.
Customer Profitability: one profitable order does not yet make a customer profitable
If one customer regularly places large orders, but each project requires free storage, five deliveries, and urgent adjustments, it is useful to look not only at the Order P&L, but also at the sum of several orders for the customer.
For example:
| Order | Revenue | Contribution |
|---|---|---|
| A-01 | 800 000 | 140 000 |
| A-02 | 1 100 000 | 95 000 |
| A-03 | 650 000 | 110 000 |
This shows the real commercial value of the relationship, not just sales volume.
Why it is dangerous to incentivize sales based only on revenue
Such a model can push a manager to:
- give unnecessary discounts;
- promise free delivery without calculation;
- split deliveries;
- agree to unprofitable urgent reorders;
- not account for cost of claims.
Revenue is needed, but for a B2B order it is useful to look at it together with contribution.
Construction materials company: which expenses to count as direct
A construction materials company can include in Order P&L those expenses that can be confidently linked specifically to a particular project.
For example:
- procurement;
- packaging;
- transportation;
- paid storage;
- specific samples;
- return or replacement;
- additional operations for the project.
Don't turn Order P&L into full-fledged accounting
The purpose of this methodology is to quickly understand the commercial effectiveness of a deal.
You don't have to allocate down to the penny:
- the director's salary;
- general office rent;
- marketing for the entire business;
- the overall IT budget.
Such expenses are important for the business as a whole, but are not always useful for operational comparison of specific orders.
It's better not to mix Direct Cost and Allocated Overhead
If the company still wants to account for part of the shared expenses, it's useful to keep them as a separate line.
For example:
CONTRIBUTION MARGIN = 177 000 ₽
ALLOCATED OVERHEAD = 45 000 ₽
ORDER RESULT AFTER ALLOCATION = 132 000 ₽
This way, both the operational economics of the order and the internal overhead allocation model are visible.
Why contribution is more convenient to use for quick commercial decisions
Contribution Margin is easier to link to a manager's actions. It changes directly due to:
- discounts;
- free shipping;
- an extra batch;
- additional packaging;
- claim cost;
- unrealized project stock.
That is why this metric is suitable for analyzing an order after project completion and preparing the next quote.
A one percent discount can significantly change absolute profit
Order — 1,000,000 ₽.
Additional 3% discount:
1 000 000 × 3% = 30 000 ₽.
If the contribution before the discount was 120,000 ₽, a 30,000 ₽ discount reduces the result by a quarter.
Therefore, a discount should be evaluated not only as a percentage of revenue, but also as a percentage of the planned contribution.
What maximum discount can the order sustain
Conventionally:
Planned contribution = 150 000 ₽
The company wants to retain at least 100,000 ₽.
Then the maximum additional discount budget:
150 000 − 100 000 = 50 000 ₽.
For an order of 1,000,000 ₽, this is equivalent to 5%. This is an example of management logic, not a universal discount rule.
“Free delivery” does not mean it is free for the seller
For the customer, delivery may be included in the price.
For the seller, it remains a Cost-to-Serve.
This is fine if the expense was built into the business model. The problem arises when free delivery is promised after the price has already been agreed and is not reflected in the calculation.
Why a minimum order amount is sometimes justified by economics
Some costs are almost the same for a 20,000 ₽ order and a 100,000 ₽ order:
- processing;
- packaging;
- vehicle;
- communication;
- assembly.
Therefore, a small project order may have a weak contribution even with a good percentage markup on the product.
Cost-to-Serve per Revenue helps compare orders
Formula:
CTS RATIO = COST-TO-SERVE / REVENUE.
For example:
Order A: CTS 80 000 / Revenue 1 000 000 = 8%
Order B: CTS 65 000 / Revenue 400 000 = 16,25%
In absolute rubles, B is cheaper to serve, but relative to revenue it is significantly heavier.
Cost-to-Serve per Meter — an additional diagnostic metric
For similar molding orders, it is sometimes convenient to calculate:
CTS PER METER = COST-TO-SERVE / shipped meters.
For example:
CTS = 60 000 ₽
Volume = 1,200 m
60,000 / 1,200 = 50 ₽/m.
This metric cannot be used to compare any different projects, but within a single order category it quickly shows where servicing has become noticeably more expensive.
When it is more profitable to combine several SKUs into one shipment
If the timeline allows, skirting boards, moulding and cornice can be consolidated into one vehicle.
Then transport is spread across a larger goods volume.
But consolidation must not:
- disrupt the site's readiness;
- create unnecessary storage;
- increase the risk of damage;
- force the client to accept goods too early.
When two deliveries can be more cost-effective than one
Sometimes one large early shipment creates paid storage, repeated handling and the risk of damage.
Then two scheduled deliveries may have higher transport costs but a lower overall Cost-to-Serve.
You need to compare:
delivery + storage + handling + risk-related direct cost.
Revenue and cash flow are not the same thing
A company may pay the supplier first, then hold the goods for a month, while the customer pays later.
Even with a good contribution margin, working capital is tied up in the order.
For a simple management estimate, two dates are enough:
CASH OUT DATE
and:
CASH IN DATE
Cash Gap shows how long money is tied up in an order
if:
CASH OUT = 01.09
CASH IN = 15.10
then the money was tied up for approximately 44 days.
Calculating a complex cost of capital is optional, but orders with the same margin and different cash gaps are not entirely equivalent.
Why customer prepayment can radically change the quality of a deal
Two orders may have the same contribution margin but different payment terms.
In the first, the customer pays an advance before purchase. In the second, the seller first finances the goods and logistics with their own money.
For a management decision, it is useful to see:
- how much equity capital is required;
- for what period;
- which client payment closes the next stage.
This is especially important for large project orders with multiple batches.
Planned Contribution and Actual Contribution should be stored separately
At the quotation stage:
PLANNED CONTRIBUTION = 220 000 ₽
After project closure:
ACTUAL CONTRIBUTION = 167 000 ₽
The deviation itself is already important:
VARIANCE = −53 000 ₽.
Margin Bridge explains where the money went
| Factor | Influence |
|---|---|
| Planned contribution | 220 000 |
| Extra delivery | −18 000 |
| Claim | −9 000 |
| Unplanned packing | −11 000 |
| Extra discount | −15 000 |
| Actual contribution | 167 000 |
Margin Bridge is far more useful than the phrase "margin turned out worse than planned."
Positive variance also needs to be recorded
Actuals can turn out better than plan.
For example:
- managed to combine two deliveries: +12,000 ₽;
- packaging cost less: +4,000 ₽;
- the client picked up part of the goods themselves: +9,000 ₽.
Margin Bridge should show both negative and positive causes. Then the company understands which decisions actually improved the order economics.
Why negative variance needs to be classified
The reasons can be different:
- SALES — additional discount;
- PROCUREMENT — purchase more expensive than plan;
- LOGISTICS — more deliveries;
- OPERATIONS — additional packaging;
- QUALITY — claim cost;
- CLIENT CHANGE — client project change.
Then the company understands exactly where to improve the process.
Order history makes the next quote more accurate
If three hotel projects show that three deliveries are almost always required, the next quote should not assume one conditional truck.
If every large project requires samples costing 5,000–7,000 ₽, sample cost becomes a planned part of cost of sale.
If a rare molding systematically leaves stranded stock, this also needs to be taken into account in advance.
How to use historical Cost-to-Serve
You can create a simple table by customer types:
| Order Type | Average number of deliveries | Typical CTS | Main risk |
|---|---|---|---|
| Hotel | 3 | ... | Phased deliveries |
| Private interior | 1–2 | ... | small volume |
| Chain of showrooms | Multiple addresses | ... | Distribution |
The company plugs in its own numbers. The methodology helps avoid starting every new calculation from scratch.
Benchmarking by order type is more useful than a single company-wide average
The average Cost-to-Serve across all orders may not tell you much. A small retail store, a hotel project, and a chain of showrooms are served differently.
That's why it's better to group the history:
- by facility type;
- by number of deliveries;
- by average square footage;
- by share of rare SKUs;
- by payment terms.
Then the next similar project gets a realistic benchmark.
When a project with lower revenue can be more profitable
Order A:
Revenue = 1 200 000 ₽
Contribution = 150 000 ₽
Order B:
Revenue = 850 000 ₽
Contribution = 170 000 ₽
B has lower revenue, but higher absolute contribution.
Therefore, ranking orders by turnover alone can distort commercial value.
When a high contribution margin still does not make an order attractive
Business constraints need to be taken into account.
For example, an order may:
- require too much warehouse space;
- tie up money for a long period;
- occupy a significant portion of transport;
- carry a high risk of stranded stock;
- create excessive operational load.
Contribution is a strong indicator, but not the only criterion for accepting an order.
Capacity Cost: a profitable order may occupy a scarce resource
If a company has one vehicle, limited warehouse space, or a small picking team, a large order may block the resource for other customers.
It is not necessary to turn this into a complex financial model. It is enough to identify the constraint:
CAPACITY CONSTRAINT — warehouse / transport / handling
This helps avoid accepting an order based solely on margin if fulfillment creates an operational conflict.
When the order is better recalculated before confirming to the client
Re-inspection is especially needed if:
- the order is small, but delivery is expensive;
- the client requests several batches;
- there are rare SKUs;
- free storage is required;
- samples and a mock-up are needed;
- project changes are expected;
- payment terms are much later than procurement.
Pre-Quote Order Economics — a quick filter before the quote
| Indicator | Plan |
|---|---|
| Revenue | ... |
| Product Cost | ... |
| Delivery | ... |
| Packing | ... |
| Samples | ... |
| Expected Extra Handling | ... |
| Planned Contribution | ... |
| CTS Ratio | ... |
This way the manager sees the economics before the price goes to the client.
The minimum contribution threshold should be set by the company, not by the article
There is no universal percentage for the "correct margin." Different companies have different cost, risk, and capital structures.
Therefore, the article does not set a standard. The company determines it itself:
- minimum contribution in rubles;
- minimum contribution %;
- maximum allowable CTS Ratio;
- what exceptions are allowed for strategic clients.
The main thing is that these decisions are based on actual economics, not just on turnover.
Actual Order Review — what to fill in after closing
After the project is completed, add:
- actual Product Cost;
- actual number of deliveries;
- actual Packing Cost;
- claim cost;
- extra delivery;
- stranded stock;
- Actual Contribution;
- Cash Gap;
- causes of variance.
Final algorithm for calculating project order profit
- Record Revenue.
- Separate Product Cost.
- Calculate Gross Margin.
- Assemble direct Cost-to-Serve.
- Break down logistics by batches.
- Account for Packing and Handling.
- Account for samples.
- Account for urgent reorders.
- Account for claims and replacements.
- Show stranded stock separately.
- Calculate Contribution Margin.
- Calculate Contribution Margin %.
- Calculate CTS Ratio.
- Record Cash Out and Cash In.
- Compare Planned Contribution with Actual.
- Build a Margin Bridge.
- Classify the causes of variance.
- Transfer actual data into the calculation of the next similar order.
The economics of a project sale of wooden trim becomes clear only after the company stops treating the simple difference between the selling and purchase price as profit.
For a single order, both the price of the goods and how much it actually cost to serve the customer matter: delivering long-length material, packaging, splitting into batches, storing, sending samples, closing an urgent reorder, and resolving a possible claim.
Order P&L and Cost-to-Serve turn these expenses into visible numbers. And Planned vs Actual Contribution shows exactly where the project lost or preserved profit and what needs to be changed in the next commercial proposal.